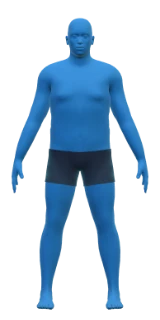
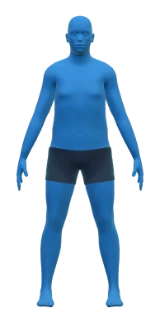
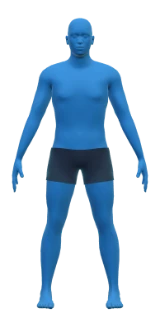
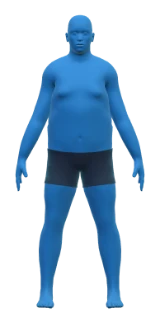
EST Body Composition Range · Woolcott & Bergman (2018) · Ashwell (2012)

Tape Body Fat Range & Waist-to-Height Calculator

Enter your height, waist circumference, weight and reference equation to estimate your body fat percentage as a range using the DXA-validated Relative Fat Mass (RFM) formula (Woolcott and Bergman, 2018) alongside your Waist-to-Height Ratio (Ashwell et al., 2012). Because any tape, smart-scale or photo estimate has an individual error band of several percentage points, Pelaris reports a range rather than a single decimal.

Core Equation & Guard-Rail

RFM (Male) = 64 − 20 × (Height ÷ Waist) · RFM (Female) = 76 − 20 × (Height ÷ Waist) · Range = ±2.5% to ±3.5%

Woolcott and Bergman (2018) validated Relative Fat Mass against DXA across 3,456 US adults in NHANES, finding lower total error than BMI. Even so, any field method (tape, bioimpedance scale, or AI photo scan) carries an individual error tolerance of roughly 3 to 4 percentage points. Use the same tape site and time of day, and watch how the range moves over 4 to 8 weeks rather than chasing a single number.

EST Body Fat Range & Waist Ratio Calculator
Open dedicated Body Shape & Ratios Calculator →
Body Fat Range EST

18–23%

Midpoint ~20% (±2.5% band)

Lean Mass Range [EST]

60.4–64.3 kg

Fat mass: 13.7–17.6 kg

Waist-to-Height (WHtR)

0.46

Below 0.50 (Ashwell adult guideline)

Sits inside the broad athletic performance window (roughly 8% to 20% for men, varying widely by sport and position).

For adults aged 18 and over. Shown as a range because every field estimate has error tolerance. Not a medical assessment.

Track My Body Scan Trend in Pelaris
About these numbers: Formula, guard-rails & 3 peer-reviewed citations ▾

RFM (Male) = 64 − 20 × (Height ÷ Waist) · RFM (Female) = 76 − 20 × (Height ÷ Waist) · Range = ±2.5% to ±3.5%

Woolcott and Bergman (2018) validated Relative Fat Mass against DXA across 3,456 US adults in NHANES, finding lower total error than BMI. Even so, any field method (tape, bioimpedance scale, or AI photo scan) carries an individual error tolerance of roughly 3 to 4 percentage points. Use the same tape site and time of day, and watch how the range moves over 4 to 8 weeks rather than chasing a single number.

  • • Relative Fat Mass (RFM) estimates whole-body fat percentage from height and waist circumference using a DXA-validated equation (64 minus 20 times height divided by waist for men; 76 minus 20 times height divided by waist for women). Like every tape or photo estimate, it carries an individual error band of several percentage points, so we show it as a range rather than a single number. [Source]
  • • Waist-to-height ratio earns its place on your card, this review of 31 studies found it a sharper screening signal than BMI or waist alone. [Source]
  • • Your waist-to-hip ratio is read against the World Health Organization's expert consultation, the global reference for what waist measurements genuinely tell us. [Source]

General fitness and training estimates only, labelled EST. Not medical advice or a clinical diagnosis.
Verified Literature

Peer-reviewed sources behind this calculator

Read full methodology in the Science Hub →

Relative Fat Mass (RFM) estimates whole-body fat percentage from height and waist circumference using a DXA-validated equation (64 minus 20 times height divided by waist for men; 76 minus 20 times height divided by waist for women). Like every tape or photo estimate, it carries an individual error band of several percentage points, so we show it as a range rather than a single number.

Woolcott, O.O. & Bergman, R.N. "Relative fat mass (RFM) as a new estimator of whole-body fat percentage , A cross-sectional study in American adult individuals." Scientific Reports, 2018;8:10980. doi:10.1038/s41598-018-29362-1

View the source

Waist-to-height ratio earns its place on your card, this review of 31 studies found it a sharper screening signal than BMI or waist alone.

Ashwell, M., Gunn, P. & Gibson, S. "Waist-to-height ratio is a better screening tool than waist circumference and BMI for adult cardiometabolic risk factors: systematic review and meta-analysis." Obesity Reviews, 2012;13(3):275-286. doi:10.1111/j.1467-789X.2011.00952.x

View the source

Your waist-to-hip ratio is read against the World Health Organization's expert consultation, the global reference for what waist measurements genuinely tell us.

World Health Organization. Waist Circumference and Waist-Hip Ratio: Report of a WHO Expert Consultation, Geneva, 8-11 December 2008. Geneva: World Health Organization, 2011. ISBN 9789241501491, 39 pp.

View the source

Frequently asked questions: Body Fat Range & Waist Ratio Calculator

Why does this calculator show a body fat range instead of one exact number?

Every field body-composition method, whether a tape measure, a bioimpedance scale, an InBody machine, or a smartphone photo scan, estimates body fat indirectly and carries an individual error band of roughly 2.5 to 4 percentage points against a laboratory 4-compartment model. Showing a range is more honest than printing a single decimal that implies laboratory precision.

What is the Relative Fat Mass (RFM) equation?

Developed by Orison Woolcott and Richard Bergman at Cedars-Sinai (Scientific Reports, 2018) and validated against DXA scans in 3,456 adults, RFM estimates whole-body fat percentage from the ratio of height to waist circumference: 64 minus 20 times (height / waist) for men, and 76 minus 20 times (height / waist) for women.

How can I make my repeat measurements more consistent?

Measure first thing in the morning after using the bathroom and before eating or drinking, place the tape level at the midpoint between your lowest rib and the top of your hip bone at the end of a normal breath out, and compare 4-week rolling trends rather than day-to-day fluctuations.