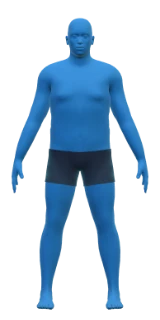
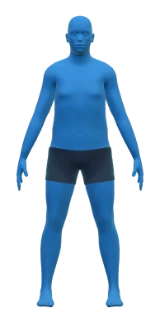
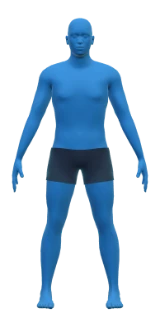
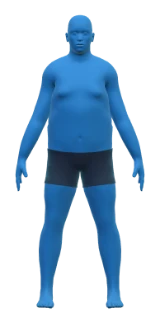
Engine Category · 11 Reference Guides

Learn Guides & Lab

Understand the mechanisms that drive adaptation: how RPE and Reps in Reserve regulate daily load, why every body composition method (DEXA, InBody, smart scale, and AI photo scan) carries an error range, and how Zone 2 and concurrent training work under the hood.

Learn Fundamentals at a Glance

  • Treat body fat % as a range (±2.5% to ±3.5%) tracked over 4-to-8-week windows rather than chasing a single decimal.
  • Most productive strength and hypertrophy work happens at 1 to 3 RIR (RPE 7 to 9) across 10 to 20 weekly sets per muscle group.
  • Separate same-day heavy lower-body lifting and running by at least 6 hours (or 48 hours before speed/long runs) to limit interference.
⚡ Interactive Learn Calculator (Run your numbers live) All 20 Calculators →
EST Body Fat Range & Waist Ratio Calculator
Open dedicated Body Shape & Ratios Calculator →
Body Fat Range EST

18–23%

Midpoint ~20% (±2.5% band)

Lean Mass Range [EST]

60.4–64.3 kg

Fat mass: 13.7–17.6 kg

Waist-to-Height (WHtR)

0.46

Below 0.50 (Ashwell adult guideline)

Sits inside the broad athletic performance window (roughly 8% to 20% for men, varying widely by sport and position).

For adults aged 18 and over. Shown as a range because every field estimate has error tolerance. Not a medical assessment.

Track My Body Scan Trend in Pelaris
About these numbers: Formula, guard-rails & 3 peer-reviewed citations ▾

RFM (Male) = 64 − 20 × (Height ÷ Waist) · RFM (Female) = 76 − 20 × (Height ÷ Waist) · Range = ±2.5% to ±3.5%

Woolcott and Bergman (2018) validated Relative Fat Mass against DXA across 3,456 US adults in NHANES, finding lower total error than BMI. Even so, any field method (tape, bioimpedance scale, or AI photo scan) carries an individual error tolerance of roughly 3 to 4 percentage points. Use the same tape site and time of day, and watch how the range moves over 4 to 8 weeks rather than chasing a single number.

  • • Relative Fat Mass (RFM) estimates whole-body fat percentage from height and waist circumference using a DXA-validated equation (64 minus 20 times height divided by waist for men; 76 minus 20 times height divided by waist for women). Like every tape or photo estimate, it carries an individual error band of several percentage points, so we show it as a range rather than a single number. [Source]
  • • Waist-to-height ratio earns its place on your card, this review of 31 studies found it a sharper screening signal than BMI or waist alone. [Source]
  • • Your waist-to-hip ratio is read against the World Health Organization's expert consultation, the global reference for what waist measurements genuinely tell us. [Source]

General fitness and training estimates only, labelled EST. Not medical advice or a clinical diagnosis.
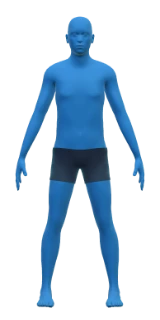
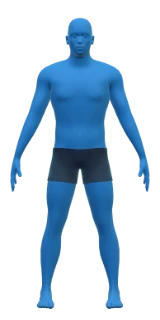
Complete Learn Shelf

All 11 Learn Reference Guides

Every guide below includes its paired interactive calculator mid-article plus FAQ answers and peer-reviewed citations.

Evidence & Primary Literature

Body Metrics, VO2max & Strength Projections Science

Woolcott & Bergman (2018) DXA-validated Relative Fat Mass, Ashwell (2012) Waist-to-Height ratio, Epley 1RM, Helms RIR, and Daniels VDOT.